TUXEDO 11gR1 Installation Guide for Beginner.
Recently, I installed TUXEDO 11gR1 on my test system. Actually, the installation isn’t difficult, if you’re already familiar with TUXEDO enviroment. But, If you aren’t, maybe you will undergo trial and error. Below is the steps of installation.
(1) Download the TUXEDO engine.
Download the TUXEDO engine.
I downloaded “Oracle Tuxedo 11gR1 (11.1.1.3.0) for Linux x86-64 (64-bit)” and that file name is tuxedo111130_64_Linux_01_x86.bin.
(2) Engine installation on the server.
2.1 Upload the tuxedo engine file to the server by FTP
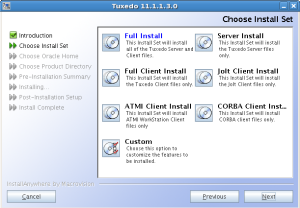
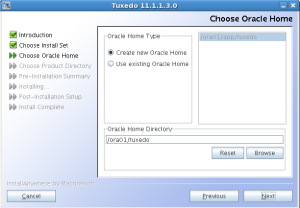
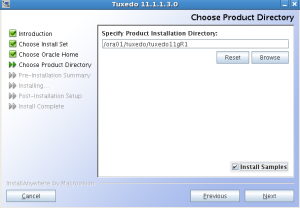
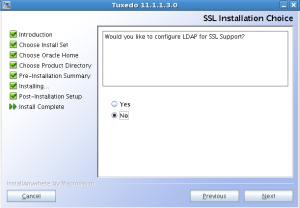
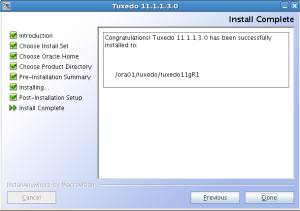
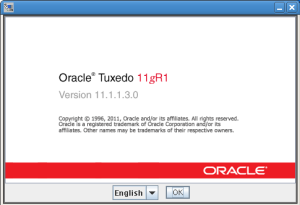
2.2 Below is the steps of TUXEDO engine installation
(3) Create a O/S user for TUXEDO and setup the environment.
[root@rac1 ~]# useradd -d /home/tuxadm -g oinstall -s /bin/bash tuxadm

[root@rac1 ~]# passwd tuxadm

Changing password for user tuxadm.

New UNIX password: ********

Retype new UNIX password: ********

passwd: all authentication tokens updated successfully.
[root@rac1 ~]# chown -R tuxadm:oinstall /ora01/tuxedo
[root@rac1 ~]# su - tuxadm
$ vi .bash_profile
export TMP=/tmp
export ORACLE_HOME=/ora01/app/oracle/product/11.2.0/db_1
export PATH=/usr/sbin:$PATH:$ORACLE_HOME/bin
export LD_LIBRARY_PATH=$ORACLE_HOME/lib:/lib:/usr/lib;
export CLASSPATH=$ORACLE_HOME/jlib:$ORACLE_HOME/rdbms/jlib;
export TUXDIR=/ora01/tuxedo/tuxedo11gR1
export JAVA_HOME=$TUXDIR/jre
export JVMLIBS=$JAVA_HOME/lib/i386/server
export PATH=.:$TUXDIR/bin:$JAVA_HOME/bin:$PATH
export COBCPY=:$TUXDIR/cobinclude
export COBOPT="-C ANS85 -C ALIGN=8 -C NOIBMCOMP -C TRUNC=ANSI -C OSEXT=cbl"
export SHLIB_PATH=$TUXDIR/lib:$JVMLIBS:$SHLIB_PATH
export LIBPATH=$TUXDIR/lib:$JVMLIBS:$LIBPATH
export LD_LIBRARY_PATH=$TUXDIR/lib:$JVMLIBS:$LD_LIBRARY_PATH
export WEBJAVADIR=$TUXDIR/udataobj/webgui/java
export APPS_HOME=$TUXDIR/APPS
export APPDIR=$TUXDIR/APPS
export TLOGDEVICE=$APPDIR/TLOG
export TUXCONFIG=$TUXDIR/APPS/tuxconfig
export ULOGPFX=$APPDIR/ULOG
export FLDTBLDIR=$TUXDIR/udataobj:$APPDIR
export WSNADDR=//192.168.0.50:9901
(4) Edit a ubbconfig file and compile the ubbconfig file.
$ cd $APPDIR

$ vi ubbconfig

*RESOURCES

IPCKEY          123456

MASTER          SITE1

MAXACCESSERS    100

MAXSERVERS      20

MAXSERVICES     20

MODEL           SHM

LDBAL           N
*MACHINES
rac1 # The name of machine must same with the result of 'uname -n'.
LMID=SITE1
TUXDIR="/ora01/tuxedo/tuxedo11gR1"
APPDIR="/ora01/tuxedo/tuxedo11gR1/APPS"
TUXCONFIG="/ora01/tuxedo/tuxedo11gR1/APPS/tuxconfig"
ULOGPFX="/ora01/tuxedo/tuxedo11gR1/APPS/ULOG"
TLOGDEVICE="/ora01/tuxedo/tuxedo11gR1/APPS/TLOG"
TLOGNAME=TLOG
MAXWSCLIENTS=10
*GROUPS
DEFAULT: LMID=SITE1
GROUP1 GRPNO=1
TMSNAME=TMS_ORA11G TMSCOUNT=5
OPENINFO="Oracle_XA:Oracle_XA+SqlNet=ORA11G2+Acc=P/scott/tiger+SesTm=60"
WSGRP GRPNO=2
*SERVERS
DEFAULT: CLOPT="-A"
sel_his SRVGRP=GROUP1 SRVID=1
sel_his SRVGRP=GROUP1 SRVID=2
sel_his SRVGRP=GROUP1 SRVID=3
sel_his SRVGRP=GROUP1 SRVID=4
noarray_ins SRVGRP=GROUP1 SRVID=101
noarray_ins SRVGRP=GROUP1 SRVID=102
WSL SRVGRP=WSGRP SRVID=20
CLOPT="-A -- -d /dev/tcp -n //192.168.0.50:9901 -w WSH -m 1 -M 4 -x 10"
*SERVICES
DEFAULT: AUTOTRAN=N
SEL_HIS
INSERT
$ tmloadcf ubbconfig
Initialize TUXCONFIG file: /ora01/tuxedo/tuxedo11gR1/APPS/tuxconfig [y, q] ? y
(5) Make a TLOG file.
$ cd $APPDIR

$ vi crtlog.sh

if [ "${1}" = "-m" ] ; then

        #

        # If -m specified, create device and TLOG

        #

        tmadmin <<-!

                echo

                crdl -z ${TLOGDEVICE}

                crlog -m SITE1

                q

                !

elif [ -z "${1}" ] ; then

        #

        # If -m not specified, create device only

        #

        tmadmin -c <<-!

                echo

                crdl -z ${TLOGDEVICE}

                q

                !

else

        #

        # If other things specified, error

        #

        echo "$0:  usage:  $0 [-m]"

        exit 2

fi
if [ ${?} -eq 0 ] ; then
echo "`basename ${0}` successful."
exit 0
fi
$ chmod 755 crtlog.sh
$ crtlog.sh -m
tmadmin - Copyright (c) 1996-2010 Oracle.
Portions * Copyright 1986-1997 RSA Data Security, Inc.
All Rights Reserved.
Distributed under license by Oracle.
Tuxedo is a registered trademark.
No bulletin board exists. Entering boot mode.
> Echo now on.
> crdl -z /ora01/tuxedo/tuxedo11gR1/APPS/TLOG
Device created: /ora01/tuxedo/tuxedo11gR1/APPS/TLOG
> crlog -m SITE1
crlog successfully completed.
> q
crtlog.sh successful.
(6) Build TMS server for XA transaction.
$ cd $APPDIR

$ buildtms -o TMS_ORA11G -r Oracle_XA

$ cp TMS_ORA11G $TUXDIR/bin
(7) Boot TUXEDO engine
How to create an excel pivot table.
Pivot table is very powerful, and very easy to use.
Whenever, our team members participate in the tuning project, we usaually use excel to manage the result of tuning. And pivot table is very useful, when we give a summary report to customers. Also,it’s very easy to use.
Below is the standard format for tuning report. It has a very detailed information, but it’s hard to see using the Module Code and Status.
So, customers want to see the statistic report through Module Code and Status. At a time like this, we use the pivot table.
1) select all cells
2) Menu-> Insert -> Pivot table
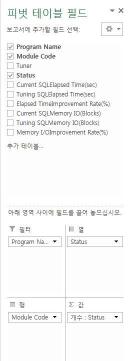
3) Locate Field to proper Area like this
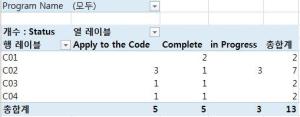
4) It’s all over, Below is the result of pivot table.
Do you want to check the I/O performance of your database machine?
Sometimes, we need to check the I/O performance of our database machine. For example, after migrating to a new machine, specific file I/O moves too slow and etc. In that case, what is the most useful tool? Maybe, ORION is the best tool to satisfy all your needs. ORION stands for ORacle IO Numbers. And ORION was included in Oracle 11gR2. So, you can find ORION executable file under $ORACLE_HOME/bin directory.
The usage of ORION is very simple. With “-help” command wil give detail usage how to use ORION.
Now, let’s try to test.
1) First of all, we must edit orion.lun file which is located in $ORACLE_HOME/bin.
In my case, I want to check the I/O performance of undo datafile only. So, edit orion.lun file like follwing.
$ cd $ORACLE_HOME/bin

$ vi orion.lun

/oradata/undotbs01.dbf
2) Run orion.
Types of workload to run are simple, normal, advanced, dss, olpt. You can find the explanations of these options, with “-help” command. I choose the simple option.
$ ORACLE_HOME/bin/orion -run simple
ORION: ORacle IO Numbers -- Version 11.2.0.3.0
orion_20130521_1540
Calibration will take approximately 9 minutes.
Using a large value for -cache_size may take longer.
3) Analysis the output files
The number of output files is 5. You can also find the explanations of these files, with “-help” command. Anyway, The files that i interested are “orion__mbps.csv” and “orion__iops.csv”. The maximum Large MBPS=14.28 which is Small=#0 and Large=#2. MBPS stands for Mega Bits Per Second.
$ cat orion_20130521_1417_mbps.csv

Large/Small,      0,      1,      2,      3,      4,      5

          1,  13.02

          2,  14.28
The maximum small IOPS=219 which is Small=#5 and Large=#0. IOPS stands for IO counts Per Second.
$ cat orion_20130521_1417_iops.csv

Large/Small,      1,      2,      3,      4,      5

          0,    138,    166,    194,    206,    219

          1

          2
The another tool for I/O calibration is DBMS_RESOURE_MANAGER.calibrate_io procedure. The usage and ouput are like following. The unit of actual_latency is millisecond (1/1,000). And, I recommand that this procedure don’t run in working time. Because, when you issue this procedure, oracle forks many background processes and run simultaneously.
SQL> set serveroutput on

DECLARE
  l_latency  PLS_INTEGER;
  l_iops     PLS_INTEGER;
  l_mbps     PLS_INTEGER;
BEGIN
   DBMS_RESOURCE_MANAGER.calibrate_io (num_physical_disks => 1,
                                       max_latency        => 20,
                                       max_iops           => l_iops,
                                       max_mbps           => l_mbps,
                                       actual_latency     => l_latency);

  DBMS_OUTPUT.put_line('Max IOPS = ' || l_iops);
  DBMS_OUTPUT.put_line('Max MBPS = ' || l_mbps);
  DBMS_OUTPUT.put_line('Latency  = ' || l_latency);
END;
/

Max IOPS = 156
Max MBPS = 10
Latency  = 18
How to turn on the Adaptive Cursor Sharing at statement level even though, _optim_peek_user_binds=false.
Although, the Adaptive Cursor Sharing(ACS) is a very useful feature, but, if you experiences some performance problem of bind peeking, maybe you turn off the bind peeking feature(_optim_peek_user_binds=false). In my previous post, I mentioned that if you turn off the bind peeking then the ACS won’t work.
In this case, we use OPT_PARAM and BIND_AWARE hint for using ACS at statement level.
 SQL> show parameter _optim

NAME                                 TYPE                   VALUE
------------------------------------ ---------------------- ------------------------------
_optim_peek_user_binds               boolean                FALSE
_optimizer_adaptive_cursor_sharing   boolean                FALSE
_optimizer_extended_cursor_sharing_r string                 NONE
el


var b1 number
exec :b1:=10;

select /*+BIND_AWARE opt_param('_optim_peek_user_binds','true') */
       count(*), max(c1), avg(c1)
from   t1
where  c2=:b1;

  COUNT(*)    MAX(C1)    AVG(C1)
---------- ---------- ----------
         1         10         10

select * from table(dbms_xplan.display_cursor);

SQL_ID  2xsn3xundg0yz, child number 0
-------------------------------------------------------------------------------------
| Id  | Operation                    | Name | Rows  | Bytes | Cost (%CPU)| Time     |
-------------------------------------------------------------------------------------
|   0 | SELECT STATEMENT             |      |       |       |     2 (100)|          |
|   1 |  SORT AGGREGATE              |      |     1 |    17 |            |          |
|   2 |   TABLE ACCESS BY INDEX ROWID| T1   |     1 |    17 |     2   (0)| 00:00:01 |
|*  3 |    INDEX RANGE SCAN          | IDX1 |     1 |       |     1   (0)| 00:00:01 |
-------------------------------------------------------------------------------------

select child_number, executions, buffer_gets,
       is_bind_sensitive, is_bind_aware
from   v$sql
where  sql_id='2xsn3xundg0yz';

CHILD_NUMBER EXECUTIONS BUFFER_GETS IS_BIND_SENSITIVE IS_BIND_AWARE
------------ ---------- ----------- ----------------- -------------
           0          1           3 Y                 Y

exec :b1:=1001;

select /*+BIND_AWARE opt_param('_optim_peek_user_binds','true') */
       count(*), max(c1), avg(c1)
from   t1
where  c2=:b1;


  COUNT(*)    MAX(C1)    AVG(C1)
---------- ---------- ----------
     99000     100000    50500.5


SQL_ID  2xsn3xundg0yz, child number 1
---------------------------------------------------------------------------
| Id  | Operation          | Name | Rows  | Bytes | Cost (%CPU)| Time     |
---------------------------------------------------------------------------
|   0 | SELECT STATEMENT   |      |       |       |  4134 (100)|          |
|   1 |  SORT AGGREGATE    |      |     1 |    17 |            |          |
|*  2 |   TABLE ACCESS FULL| T1   | 99016 |  1643K|  4134   (1)| 00:00:50 |
---------------------------------------------------------------------------

select child_number, executions, buffer_gets,
       is_bind_sensitive, is_bind_aware
from   v$sql
where  sql_id='2xsn3xundg0yz';

CHILD_NUMBER EXECUTIONS BUFFER_GETS IS_BIND_SENSITIVE IS_BIND_AWARE
------------ ---------- ----------- ----------------- -------------
           0          1           3 Y                 Y
           1          1       14593 Y                 Y
The behavior of BIND_AWARE hint.
Oracle supports BIND_AWARE and NO_BIND_AWARE hints that could control the Adaptive Cursor Sharing. From the name of each hint, We could expect the behavior. The test of NO_BIND_AWARE hint is unnecessary. That hint is so clear. But, BIND_AWARE hint isn’t clear to me. So let’s try to test.
BIND_AWARE hint.
For the test, the disable parameter value would be needed.
alter session set "_optimizer_adaptive_cursor_sharing"=false;
alter session set "_optimizer_extended_cursor_sharing_rel"=false;
Next, execute query using hint. The test environment is all same as previous post.
From the test result, we know that BIND_WARE hint works well regardless of the parameter value.
var b1 number
exec :b1:=10;

select /*+BIND_AWARE*/
       count(*), max(c1)
from   t1
where  c2=:b1;

  COUNT(*)    MAX(C1)
---------- ----------
         1         10

select * from table(dbms_xplan.display_cursor);

SQL_ID  9avbm7xarm430, child number 0
------------------------------------------------------------------------------------
| Id  | Operation                    | Name | Rows  | Bytes | Cost (%CPU)| Time     |
-------------------------------------------------------------------------------------
|   0 | SELECT STATEMENT             |      |       |       |     2 (100)|          |
|   1 |  SORT AGGREGATE              |      |     1 |    17 |            |          |
|   2 |   TABLE ACCESS BY INDEX ROWID| T1   |     1 |    17 |     2   (0)| 00:00:01 |
|*  3 |    INDEX RANGE SCAN          | IDX1 |     1 |       |     1   (0)| 00:00:01 |
-------------------------------------------------------------------------------------

select child_number, executions, buffer_gets,
       is_bind_sensitive, is_bind_aware
from   v$sql
where  sql_id='9avbm7xarm430';
CHILD_NUMBER EXECUTIONS BUFFER_GETS IS_BIND_SENSITIVE IS_BIND_AWARE
------------ ---------- ----------- ----------------- -------------
           0          1           3 Y                 Y

exec :b1:=1001;

select /*+BIND_AWARE*/
       count(*), max(c1)
from   t1
where  c2=:b1;
  COUNT(*)    MAX(C1)
---------- ----------
     99000     100000

SQL_ID  9avbm7xarm430, child number 1
---------------------------------------------------------------------------
| Id  | Operation          | Name | Rows  | Bytes | Cost (%CPU)| Time     |
---------------------------------------------------------------------------
|   0 | SELECT STATEMENT   |      |       |       |  4134 (100)|          |
|   1 |  SORT AGGREGATE    |      |     1 |    17 |            |          |
|*  2 |   TABLE ACCESS FULL| T1   | 99016 |  1643K|  4134   (1)| 00:00:50 |
---------------------------------------------------------------------------

select child_number, executions, buffer_gets,
       is_bind_sensitive, is_bind_aware
from   v$sql
where  sql_id='9avbm7xarm430';

CHILD_NUMBER EXECUTIONS BUFFER_GETS IS_BIND_SENSITIVE IS_BIND_AWARE
------------ ---------- ----------- ----------------- -------------
           0          1           3 Y                 Y
           1          1       14593 Y                 Y
After the test, I wonder that BIND_AWARE hint can even work, even if “_optim_peek_user_binds”=false? As expected, if “_optim_peek_user_binds”=false then ACS can’t work. Because, if you turn off the feature of bind peeking then the oracle doesn’t peek any bind variable.
alter session set "_optim_peek_user_binds"=false;
var b1 number
exec :b1:=10;

select /*+BIND_AWARE*/
       count(*), max(c1), min(c1)
from   t1
where  c2=:b1;

  COUNT(*)    MAX(C1)    MIN(C1)
---------- ---------- ----------
         1         10         10

select * from table(dbms_xplan.display_cursor);

SQL_ID  1wx1pmnfj5ajp, child number 0
-------------------------------------------------------------------------------------
| Id  | Operation                    | Name | Rows  | Bytes | Cost (%CPU)| Time     |
-------------------------------------------------------------------------------------
|   0 | SELECT STATEMENT             |      |       |       |    16 (100)|          |
|   1 |  SORT AGGREGATE              |      |     1 |    17 |            |          |
|   2 |   TABLE ACCESS BY INDEX ROWID| T1   |   100 |  1700 |    16   (0)| 00:00:01 |
|*  3 |    INDEX RANGE SCAN          | IDX1 |   100 |       |     1   (0)| 00:00:01 |
-------------------------------------------------------------------------------------

select child_number, executions, buffer_gets,
       is_bind_sensitive, is_bind_aware
from   v$sql
where  sql_id='1wx1pmnfj5ajp';

CHILD_NUMBER EXECUTIONS BUFFER_GETS IS_BIND_SENSITIVE IS_BIND_AWARE
------------ ---------- ----------- ----------------- -------------
           0          1           3 N                 N
The mechanism of Adaptive Cursor Sharing.
Adaptive Cursor Sharing(ACS) was introduced in oracle 11g. Until 10g, the oracle only supports bind peeking (from 9i). But, bind peeking has a big problem, when the column in the where clause with the bind has a skew data.To solve that problem ACS need to use a column histogram. Now, try to test to understand the ACS.
(1) Create a table and insert skew data.
create table t1 (c1 number, c2 number, dummy char(1000));

insert into t1
select level, level, 'dummy'
from   dual
connect by level<=1000
union all
select level+1000, 1001, 'dummy'
from   dual
connect by level<=99000;

commit;

create index idx1 on t1(c2) nologging;
exec dbms_stats.gather_table_stats(user,'T1', method_opt=>'FOR ALL INDEXED COLUMNS SIZE 254');
(2) c2 column has (HEIGHT BALANCED) histogram.
select column_name, histogram from user_tab_columns where table_name='T1'
order by column_id;

COLUMN_NAME  HISTOGRAM
-----------  ----------------
C1           NONE
C2           HEIGHT BALANCED
DUMMY        NONE
(3) Now, let’s try to test.
The value of all hidden parameters that was related to ACS are default (_optimizer_adaptive_cursor_sharing=true, _optimizer_extended_cursor_sharing_rel=simple). First bind value is 10 and the number of rows is 1, so optimizer decided to index scan. it was good choice.
var b1 number
exec :b1:=10;

select /*_ACS1*/
       count(*), max(c1)
from   t1
where  c2=:b1;

  COUNT(*)    MAX(C1)
---------- ----------
         1         10

select * from table(dbms_xplan.display_cursor);

SQL_ID  as9xzr2tdxj5u, child number 0
-------------------------------------------------------------------------------------
| Id  | Operation                    | Name | Rows  | Bytes | Cost (%CPU)| Time     |
-------------------------------------------------------------------------------------
|   0 | SELECT STATEMENT             |      |       |       |     2 (100)|          |
|   1 |  SORT AGGREGATE              |      |     1 |    17 |            |          |
|   2 |   TABLE ACCESS BY INDEX ROWID| T1   |     1 |    17 |     2   (0)| 00:00:01 |
|*  3 |    INDEX RANGE SCAN          | IDX1 |     1 |       |     1   (0)| 00:00:01 |
-------------------------------------------------------------------------------------
And that cursor was marked IS_BIND_SENSITIVE=’Y’.
select child_number, executions, buffer_gets,
       is_bind_sensitive, is_bind_aware
from   v$sql
where  sql_id='as9xzr2tdxj5u';

CHILD_NUMBER EXECUTIONS BUFFER_GETS IS_BIND_SENSITIVE IS_BIND_AWARE
------------ ---------- ----------- ----------------- -------------
           0          1           3 Y                 N
Second bind value is 1001 and the number of rows is 99,000. So, in this case, full scan is better than index scan. But, against my expectations, the optimizer still has been decided to do index scan.
exec :b1:=1001;
select /*_ACS1*/
       count(*), max(c1)
from   t1
where  c2=:b1;

  COUNT(*)    MAX(C1)
---------- ----------
     99000     100000

select * from table(dbms_xplan.display_cursor);

SQL_ID  as9xzr2tdxj5u, child number 0
-------------------------------------------------------------------------------------
| Id  | Operation                    | Name | Rows  | Bytes | Cost (%CPU)| Time     |
-------------------------------------------------------------------------------------
|   0 | SELECT STATEMENT             |      |       |       |     2 (100)|          |
|   1 |  SORT AGGREGATE              |      |     1 |    17 |            |          |
|   2 |   TABLE ACCESS BY INDEX ROWID| T1   |     1 |    17 |     2   (0)| 00:00:01 |
|*  3 |    INDEX RANGE SCAN          | IDX1 |     1 |       |     1   (0)| 00:00:01 |
-------------------------------------------------------------------------------------
If that statement was executed one more time by same bind value (1001), then oracle will create a new child cursor(#1) and the optimizer will do full scan. And then, that cursor was marked IS_BIND_AWARE=’Y’.
select /*_ACS1*/
count(*), max(c1)
from t1
where c2=:b1;

 COUNT(*) MAX(C1)
---------- ----------
    99000 100000

select * from table(dbms_xplan.display_cursor);

SQL_ID  as9xzr2tdxj5u, child number 1
---------------------------------------------------------------------------
| Id  | Operation          | Name | Rows  | Bytes | Cost (%CPU)| Time     |
---------------------------------------------------------------------------
|   0 | SELECT STATEMENT   |      |       |       |  4134 (100)|          |
|   1 |  SORT AGGREGATE    |      |     1 |    17 |            |          |
|*  2 |   TABLE ACCESS FULL| T1   | 99016 |  1643K|  4134   (1)| 00:00:50 |
---------------------------------------------------------------------------

select child_number, executions, buffer_gets,
       is_bind_sensitive, is_bind_aware
from   v$sql
where  sql_id='as9xzr2tdxj5u';

CHILD_NUMBER EXECUTIONS BUFFER_GETS IS_BIND_SENSITIVE IS_BIND_AWARE
------------ ---------- ----------- ----------------- -------------
           0          2       14356 Y                 N
           1          1       14593 Y                 Y

The third bind value is 20 and the number of rows is 1. When we execute that sql statement, oracle creates a new child cursor(#2) and optimizer decided to index scan. From that time, the child cursor (#0) was no longer be used. That was marked IS_SHAERABLE='N'.
exec :b1:=20

elect /*_ACS1*/
       count(*), max(c1)
from   t1
where  c2=:b1;

select * from table(dbms_xplan.display_cursor);

SQL_ID  as9xzr2tdxj5u, child number 2
-------------------------------------------------------------------------------------
| Id  | Operation                    | Name | Rows  | Bytes | Cost (%CPU)| Time     |
-------------------------------------------------------------------------------------
|   0 | SELECT STATEMENT             |      |       |       |     2 (100)|          |
|   1 |  SORT AGGREGATE              |      |     1 |    17 |            |          |
|   2 |   TABLE ACCESS BY INDEX ROWID| T1   |     1 |    17 |     2   (0)| 00:00:01 |
|*  3 |    INDEX RANGE SCAN          | IDX1 |     1 |       |     1   (0)| 00:00:01 |
-------------------------------------------------------------------------------------

select child_number, executions, buffer_gets,
       is_bind_sensitive, is_bind_aware, is_shareable
from   v$sql
where  sql_id='as9xzr2tdxj5u';

CHILD_NUMBER EXECUTIONS BUFFER_GETS IS_BIND_SENSITIVE IS_BIND_AWARE IS_SHAREABLE
------------ ---------- ----------- ----------------- ------------- ------------
           0          2       14356 Y                 N             N
           1          1       14593 Y                 Y             Y
           2          1           3 Y                 Y             Y
The simple example of unpivot.
Unpivot provides very conveninent way, when we search on v$sql_shared_cursor view.
When, we want to know the reason of multiple child cursors, we look at the v$sql_shared_cursor view. But, that view isn’t user-friendly. In this case, we can use unpivot feature from oracle 11g like this. The oracle version of test environment is 11.2.0.3.
-- fnd_shared_cursor.sql

WITH v1 AS (
          SELECT *
          FROM   v$sql_shared_cursor
          WHERE  sql_id=:sql_id
     )
SELECT sql_id ,
       child_number ,
       reason_type ,
       result
FROM   v1
unpivot (result FOR reason_type IN
(
-- columns are vary depend on oracle version
"UNBOUND_CURSOR",
"SQL_TYPE_MISMATCH",
"OPTIMIZER_MISMATCH",
"OUTLINE_MISMATCH",
"STATS_ROW_MISMATCH",
"LITERAL_MISMATCH",
"FORCE_HARD_PARSE",
"EXPLAIN_PLAN_CURSOR",
"BUFFERED_DML_MISMATCH",
"PDML_ENV_MISMATCH",
"INST_DRTLD_MISMATCH",
"SLAVE_QC_MISMATCH",
"TYPECHECK_MISMATCH",
"AUTH_CHECK_MISMATCH",
"BIND_MISMATCH",
"DESCRIBE_MISMATCH",
"LANGUAGE_MISMATCH",
"TRANSLATION_MISMATCH",
"BIND_EQUIV_FAILURE",
"INSUFF_PRIVS",
"INSUFF_PRIVS_REM",
"REMOTE_TRANS_MISMATCH",
"LOGMINER_SESSION_MISMATCH",
"INCOMP_LTRL_MISMATCH",
"OVERLAP_TIME_MISMATCH",
"EDITION_MISMATCH",
"MV_QUERY_GEN_MISMATCH",
"USER_BIND_PEEK_MISMATCH",
"TYPCHK_DEP_MISMATCH",
"NO_TRIGGER_MISMATCH",
"FLASHBACK_CURSOR",
"ANYDATA_TRANSFORMATION",
"PDDL_ENV_MISMATCH",
"TOP_LEVEL_RPI_CURSOR",
"DIFFERENT_LONG_LENGTH",
"LOGICAL_STANDBY_APPLY",
"DIFF_CALL_DURN",
"BIND_UACS_DIFF",
"PLSQL_CMP_SWITCHS_DIFF",
"CURSOR_PARTS_MISMATCH",
"STB_OBJECT_MISMATCH",
"CROSSEDITION_TRIGGER_MISMATCH",
"PQ_SLAVE_MISMATCH",
"TOP_LEVEL_DDL_MISMATCH",
"MULTI_PX_MISMATCH",
"BIND_PEEKED_PQ_MISMATCH",
"MV_REWRITE_MISMATCH",
"ROLL_INVALID_MISMATCH",
"OPTIMIZER_MODE_MISMATCH",
"PX_MISMATCH",
"MV_STALEOBJ_MISMATCH",
"FLASHBACK_TABLE_MISMATCH",
"LITREP_COMP_MISMATCH",
"PLSQL_DEBUG",
"LOAD_OPTIMIZER_STATS",
"ACL_MISMATCH",
"FLASHBACK_ARCHIVE_MISMATCH",
"LOCK_USER_SCHEMA_FAILED",
"REMOTE_MAPPING_MISMATCH",
"LOAD_RUNTIME_HEAP_FAILED",
"HASH_MATCH_FAILED",
"PURGED_CURSOR",
"BIND_LENGTH_UPGRADEABLE",
"USE_FEEDBACK_STATS")
)
where result='Y';

--Sample Output
SQL_ID        CHILD_NUMBER  REASON_TYPE          RESULT
c9q44tap900dw 1             EXPLAIN_PLAN_CURSOR  Y
c9q44tap900dw 2             EXPLAIN_PLAN_CURSOR  Y
The simple example of MODEL clause.
In my previous post, i mentioned about partition outer join to make report layout.
There is another way to make a report layout using a model clause like this. It just sample for learning to MODEL clause.
WITH v1 AS (
           SELECT a.site ,
                  a.item ,
                  a.category ,
                  SUM( a.amount ) amount
           FROM   t2 a
           GROUP  BY a.site ,
                  a.item ,
                  a.category
     )
select s, i, c, a
from   v1
Spreadsheet
partition by (site s, item i)
dimension by (category c)
measures (amount a)
rules
(
  a['C01'] = PRESENTV(a['C01'], a['C01'], 0),
  a['C02'] = PRESENTV(a['C02'], a['C02'], 0),
  a['C03'] = PRESENTV(a['C03'], a['C03'], 0),
  a['C04'] = PRESENTV(a['C04'], a['C04'], 0),
  a['C05'] = PRESENTV(a['C05'], a['C05'], 0),
  a['C06'] = PRESENTV(a['C06'], a['C06'], 0),
  a['C07'] = PRESENTV(a['C07'], a['C07'], 0),
  a['C08'] = PRESENTV(a['C08'], a['C08'], 0),
  a['C09'] = PRESENTV(a['C09'], a['C09'], 0),
  a['C10'] = PRESENTV(a['C10'], a['C10'], 0)
)
order by s,i,c

call     count       cpu    elapsed       disk      query    current       rows        mis   Wait Ela
------- ------  -------- ---------- ---------- ---------- ---------- ---------- ---------- ----------
Parse        1      0.25       1.90        451        277          1          0          1       0.00
Exec         1      0.00       0.00          0          0          0          0          0       0.00
Fetch    40000    143.09     197.66     101622      22029         17     999995          0     191.56
------- ------  -------- ---------- ---------- ---------- ---------- ---------- ---------- ----------
Total    40002    143.34     199.55     102073      22306         18     999995          1     191.56

Event waited on                             Count Zero Ela     Elapse   AVG(Ela)   MAX(Ela)   Blocks
---------------------------------------- -------- -------- ---------- ---------- ---------- --------
Disk file operations I/O                        1        0       0.00       0.00       0.00        0
direct path write temp                       1561        0      41.10       0.03       0.28        0
SQL*Net message to client                   40001        0       0.26       0.00       0.00        0
direct path read                               67        0       1.39       0.02       0.25        0
SQL*Net message from client                 40001        0     153.81       0.00      18.39        0
direct path read temp                        1194        0      13.38       0.01       0.19        0

Rows       Row Source Operation
---------- ---------------------------------------------------
    999995 SORT ORDER BY (cr=22029 pr=101622 pw=79781 time=178073503 us cost=6243 size=226319654 card=709466)
    999995  SQL MODEL ORDERED FAST (cr=22029 pr=61614 pw=39773 time=67399100 us cost=6243 size=226319654 card=709466)
    499995   HASH GROUP BY (cr=22029 pr=39883 pw=18042 time=30056894 us cost=6243 size=226319654 card=709466)
    499995    TABLE ACCESS FULL T2 (cr=22029 pr=21841 pw=0 time=2490717 us cost=6089 size=226319654 card=709466)
You can use hint using pg_plan_hint for PostgreSQL.
Sourceforge.JP offers pg_plan_hint for PostgreSQL for free.
In my previous post, I mentioned about a hint for PostgreSQL. But, if you just need hint feature in EDB(enterprise database), the cost of EDB might be a little expensive. And, according to http://wiki.postgresql.org/wiki/OptimizerHintsDiscussion, postgresql has no plan about hint. So, if you just need the hint feature, you can consider the pg_plan_hint. The pg_plan_hint is provided by sourceforge.JP. The usage of pg_plan_hint is similar with oracle. Actually, I don’t know, pg_plan_hint is bugfree. But, through my simple test, I think that pg_plan_hint can use in simple case. For the test, first of all, Let’s install the pg_plan_hint.
1) Download pg_plan_hint
http://en.sourceforge.jp/projects/pghintplan/
In my case, I downloaded “pg_hint_plan92-1.0.0.tar.gz” file.
2) File upload and extract file
> ftp hostip

user: ****

password: ***
$ gunzip pg_hint_plan92-1.0.0.tar.gz
$ tar xvf pg_hint_plan92-1.0.0.tar
3) Installation
$ cd pg_hint_plan92-1.0.0

--The value of PG_CONFIG is maybe diffent, depend on your environment.

$ make PG_CONFIG=/usr/local/pgsql/bin/pg_config

$ make PG_CONFIG=/usr/local/pgsql/bin/pg_config install
If you already installed PGXC, you meet the compile error like this.
 pg_hint_plan.c:1554: warning: passing arg 6 of pointer to function makes integer from pointer without a cast

 pg_hint_plan.c:1554: error: too few arguments to function

 make: *** [pg_hint_plan.o] Error 1
Then, you just edit /usr/local/pgsql/include/server/tcop/utility.h for fix error.
$ vi /usr/local/pgsql/include/server/tcop/utility.h

 #ifndef UTILITY_H

 #define UTILITY_H

 #include "tcop/tcopprot.h"

 #undef PGXC     -- add this line
-- Edit postgresql.conf file
$ cd /usr/local/pgsql/data/datanode1/
$ vi postgresql.conf
shared_preload_libraries='pg_hint_plan' -- add this line
-- restart pgsql
$ pg_ctl stop -D /usr/local/pgsql/data/datanode1 -m fast
$ pg_ctl start -D /usr/local/pgsql/data/datanode1 -Z datanode -l logfile
From now, we can use hint for pgsql. Let’s do a test.
(1) Create table/index and data loading.
create table t1 (c1 int, c2 int, c3 int, dummy char(100));
create index t1_idx1 on t1 (c1, c2, c3);
create index t1_idx2 on t1 (c2, c3);
create index t1_idx3 on t1 (c3);
create index t1_idx4 on t1 (c1);

create table t2 (c1 int, c2 int, c3 int, dummy char(100));
create index t2_idx1 on t2 (c1, c2, c3);
create index t2_idx2 on t2 (c2, c3);
create index t2_idx3 on t2 (c3);

create table t3 (c1 int, c2 int, c3 int, dummy char(100));
create index t3_idx1 on t3 (c1, c2, c3);
create index t3_idx2 on t3 (c2, c3);
create index t3_idx3 on t3 (c3);

insert into t1 select 1, mod(c1,100), mod(c1,1000), 'dummy' from generate_series(1,100000) c1;
insert into t2 select 1, mod(c1,100), mod(c1,1000), 'dummy' from generate_series(1,10000) c1;
insert into t3 select 1, mod(c1,100), mod(c1,1000), 'dummy' from generate_series(1,100) c1;
(2) The test of IndexScan and SeqScan hints.
In my test case, IndexScan and SeqScan hints are working very well.
/*+ IndexScan(t1 t1_idx1) */
explain analyze
select *
from   t1
where  c1=1
and    c2=10
and    c3=100

"Index Scan using t1_idx1 on t1  (cost=0.00..8.29 rows=1 width=113) (actual time=0.021..0.021 rows=0 loops=1)"
"  Index Cond: ((c1 = 1) AND (c2 = 10) AND (c3 = 100))"
"Total runtime: 0.056 ms"

/*+ IndexScan(t1 t1_idx4) */
explain analyze
select *
from   t1
where  c1=1
and    c2=10
and    c3=100

"Index Scan using t1_idx4 on t1  (cost=0.00..4923.26 rows=1 width=113) (actual time=99.512..99.512 rows=0 loops=1)"
"  Index Cond: (c1 = 1)"
"  Filter: ((c2 = 10) AND (c3 = 100))"
"Total runtime: 99.556 ms"

/*+ SeqScan(t1) */
explain analyze
select *
from   t1
where  c1=1
and    c2=10
and    c3=100

"Seq Scan on t1  (cost=0.00..3536.00 rows=1 width=113) (actual time=49.532..49.532 rows=0 loops=1)"
"  Filter: ((c1 = 1) AND (c2 = 10) AND (c3 = 100))"
"Total runtime: 49.571 ms"
(3) The test of Leading, NestLoop, HashJoin hints.
In my test case, all hints were working very well.
And the usage of NestLoop and HashJoin hints were are little different with oracle. Oracle uses one or two argument in use_nl and use_hash hints. For example, I want to use nested loops join with a, b, c table in order. In that case,
we use /*+ leading(a b c) use_nl(b) use_nl(c) */ or /*+ leading(a b c) use_nl(a b) use_nl(b c) */.
But, in case of pg_plan_hint, we use /*+ leading(a b c) NestLoop(a b) NestLoop(a b c) */.
/*+ Leading(c b a) NestLoop(c b) HashJoin(c b a) */
explain analyze
select a.*, b.*, c.*
from   t1 a, t2 b, t3 c
where  a.c1=b.c1
and    a.c2=b.c2
and    a.c3=b.c3
and    b.c1=c.c1
and    b.c2=c.c2
and    b.c3=c.c3

"Hash Join  (cost=504.08..4415.18 rows=10 width=339) (actual time=6.825..342.277 rows=100000 loops=1)"
"  Hash Cond: ((a.c1 = b.c1) AND (a.c2 = b.c2) AND (a.c3 = b.c3))"
"  ->  Seq Scan on t1 a  (cost=0.00..2786.00 rows=100000 width=113) (actual time=0.014..80.097 rows=100000 loops=1)"
"  ->  Hash  (cost=503.91..503.91 rows=10 width=226) (actual time=6.754..6.754 rows=1000 loops=1)"
"        Buckets: 1024  Batches: 1  Memory Usage: 244kB"
"        ->  Nested Loop  (cost=0.00..503.91 rows=10 width=226) (actual time=0.037..4.971 rows=1000 loops=1)"
"              Join Filter: (b.c1 = c.c1)"
"              ->  Seq Scan on t3 c  (cost=0.00..3.00 rows=100 width=113) (actual time=0.009..0.098 rows=100 loops=1)"
"              ->  Index Scan using t2_idx2 on t2 b  (cost=0.00..4.99 rows=1 width=113) (actual time=0.011..0.028 rows=10 loops=100)"
"                    Index Cond: ((c2 = c.c2) AND (c3 = c.c3))"
"Total runtime: 391.877 ms"

/*+ Leading(a b c) HashJoin(a b) NestLoop(a b c) */
explain analyze
select a.*, b.*, c.*
from   t1 a, t2 b, t3 c
where  a.c1=b.c1
and    a.c2=b.c2
and    a.c3=b.c3
and    b.c1=c.c1
and    b.c2=c.c2
and    b.c3=c.c3

"Nested Loop  (cost=625.00..14466.80 rows=10 width=339) (actual time=22.144..6251.758 rows=100000 loops=1)"
"  Join Filter: ((a.c1 = c.c1) AND (a.c2 = c.c2))"
"  ->  Hash Join  (cost=625.00..11600.00 rows=10000 width=226) (actual time=22.114..1928.040 rows=1000000 loops=1)"
"        Hash Cond: ((a.c1 = b.c1) AND (a.c2 = b.c2) AND (a.c3 = b.c3))"
"        ->  Seq Scan on t1 a  (cost=0.00..2786.00 rows=100000 width=113) (actual time=0.013..93.049 rows=100000 loops=1)"
"        ->  Hash  (cost=279.00..279.00 rows=10000 width=113) (actual time=22.019..22.019 rows=10000 loops=1)"
"              Buckets: 1024  Batches: 2  Memory Usage: 669kB"
"              ->  Seq Scan on t2 b  (cost=0.00..279.00 rows=10000 width=113) (actual time=0.008..8.505 rows=10000 loops=1)"
"  ->  Index Scan using t3_idx3 on t3 c  (cost=0.00..0.27 rows=1 width=113) (actual time=0.002..0.002 rows=0 loops=1000000)"
"        Index Cond: (c3 = a.c3)"
"Total runtime: 6308.625 ms"

/*+ Leading(a b c) NestLoop(a b) NestLoop(a b c) */
explain analyze
select a.*, b.*, c.*
from   t1 a, t2 b, t3 c
where  a.c1=b.c1
and    a.c2=b.c2
and    a.c3=b.c3
and    b.c1=c.c1
and    b.c2=c.c2
and    b.c3=c.c3

"Nested Loop  (cost=0.00..14722.40 rows=10 width=339) (actual time=0.067..8733.899 rows=100000 loops=1)"
"  Join Filter: ((a.c1 = c.c1) AND (a.c2 = c.c2))"
"  ->  Nested Loop  (cost=0.00..11855.60 rows=10000 width=226) (actual time=0.055..4084.912 rows=1000000 loops=1)"
"        Join Filter: (a.c1 = b.c1)"
"        ->  Seq Scan on t2 b  (cost=0.00..279.00 rows=10000 width=113) (actual time=0.014..10.070 rows=10000 loops=1)"
"        ->  Index Scan using t1_idx2 on t1 a  (cost=0.00..1.14 rows=1 width=113) (actual time=0.017..0.232 rows=100 loops=10000)"
"              Index Cond: ((c2 = b.c2) AND (c3 = b.c3))"
"  ->  Index Scan using t3_idx3 on t3 c  (cost=0.00..0.27 rows=1 width=113) (actual time=0.002..0.003 rows=0 loops=1000000)"
"        Index Cond: (c3 = a.c3)"
"Total runtime: 8791.946 ms"
The simple example of recursive subquery factoring.
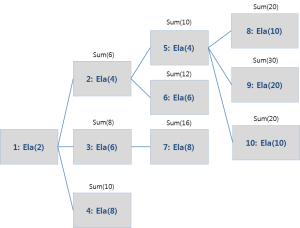
Maybe, recursive subquery factoring was used in few cases only. But in that case, recursive subquery factoring provides very convenient way to handle each node.
For example, there is a diagram like below and we want calculate the ela(psed time) to current node. Without the recursive subquery factoring, we shoud use sys_connect_by_path and user define function.
